1
2
3
4
5
6
7
8
9
10
11
12
13
14
15
16
17
18
19
20
21
22
23
24
25
26
27
28
29
30
31
32
33
34
35
36
37
38
39
40
41
42
43
44
45
46
47
48
49
50
51
52
53
54
55
56
57
58
59
60
61
62
63
64
65
66
67
68
69
70
71
72
73
|
#LC8计算ndvi正式版
import rasterio
from rasterio import plot
import matplotlib.pyplot as plt
import numpy as np
import os
from rasterio import transform
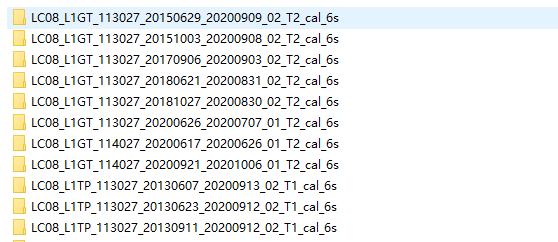
filepath = "D:/Data/Landsat_8_retry_cal_6s"
productIOs = []

pathlist = os.listdir(filepath) #遍历整个文件夹下文件夹的名字  并返回一个列表
#print(pathlist)
for i in pathlist:
    product_path = filepath + '/' + str(i)
    product_list = os.listdir(product_path)
    for product in product_list:
        productIOs.append(product.split(".")[0])
    for productIO in productIOs:
        if productIO[-2:]=='B4':
            band4path = product_path + '/' + str(productIO) + '.TIF'

    for productIO in productIOs:
        if productIO[-2:]=='B5':
            band5path = product_path + '/' + str(productIO) + '.TIF'

    for productIO in productIOs:
        if productIO[-2:]=='B3':
            band3path = product_path + '/' + str(productIO) + '.TIF'
    band4 = rasterio.open(band4path)
    band5 = rasterio.open(band5path)
    band3 = rasterio.open(band3path)
    red = band4.read(1).astype('float64')
    nir = band5.read(1).astype('float64')
    green = band3.read(1).astype('float64')
#植被生理参数
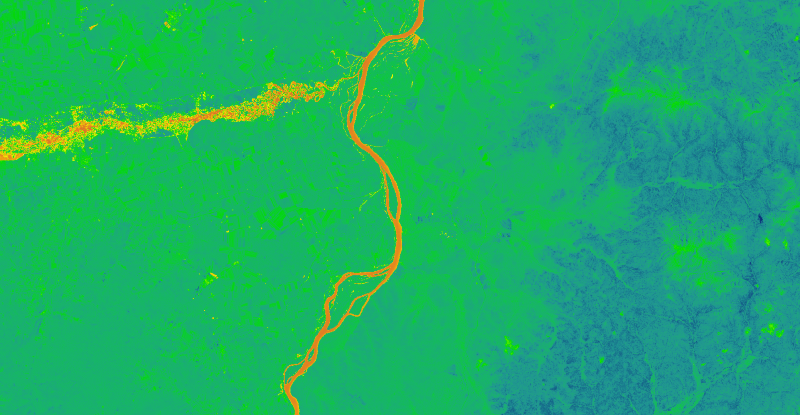
ndvi =( nir - red )/(nir+red)
fapar = 107.5*ndvi - 8.0
lai = 5*np.log(ndvi)+ 4.22
ci = nir/green - 1
ccc = ci*0.89+7.47
#ndvi
ndvi_output_path = "D:/Data/NDVI_files"
output_ndvi = ndvi_output_path + '/' + str(i) + '_ndvi' +'.TIF'
ndviImage = rasterio.open(output_ndvi,'w',driver='Gtiff',width=band4.width,height = band4.height,\
    count=1,crs = band4.crs,transform=band4.transform,dtype='float64')
ndviImage.write(ndvi,1)
ndviImage.close()
#FAPAR
fapar_output_path = "D:/Data/FAPAR_files"
output_fapar = fapar_output_path + '/' + str(i) + '_fapar' +'.TIF'
faparImage = rasterio.open(output_fapar,'w',driver='Gtiff',width=band4.width,height = band4.height,\
    count=1,crs = band4.crs,transform=band4.transform,dtype='float64')
faparImage.write(fapar,1)
faparImage.close()
#LAI
LAI_output_path = "D:/Data/LAI_files"
output_LAI = LAI_output_path + '/' + str(i) + '_LAI' +'.TIF'
LAIImage = rasterio.open(output_LAI,'w',driver='Gtiff',width=band4.width,height = band4.height,\
    count=1,crs = band4.crs,transform=band4.transform,dtype='float64')
LAIImage.write(lai,1)
LAIImage.close()
#CCC
CCC_output_path = "D:/Data/CCC_files"
output_CCC = CCC_output_path + '/' + str(i)  +'.TIF'
CCCImage = rasterio.open(output_CCC,'w',driver='Gtiff',width=band4.width,height = band4.height,count=1,crs = band4.crs,transform=band4.transform,dtype='float64')
CCCImage.write(ccc,1)
CCCImage.close()
|