
After experiencing the huge project of migrating from Hexo to hugo, I found that I have been working on the whole framework configuration without putting the article into practice, so now I write the content that I have been hoarding first. This article introduces the generation of image-by-image metadata based on python-l8-angles for the Landsat series data solar altitude angle and other poses, and finally generates raster images of remote sensor poses based on this package.
Introduction
The Sentinel image processing software SNAP Desktop of ESA has a processing module called Biophysical Processor, which is used to invert various vegetation physiological parameters such as leaf area index (LAI), chlorophyll (Cab), light and effective absorbed radiation ratio (FAPAR), vegetation cover (FCOVER), and canopy water content (CW). The module has been used to generate biophysical products for the VEGETATION, MERIS, SPOT and LANDSAT sensors. It consists mainly of generating a comprehensive database of vegetation characteristics and associated parameters, SENTINEL2 or LANDSAT8 top-of-canopy (TOC) reflectance. The neural network is then trained to estimate canopy features based on TOC reflectance and the corresponding angles of the settings defining the observation configuration. For Sentinel-2, two different neural network architectures were implemented, NNET 20m and NNET 10m. In addition to the auxiliary bands cos(viewing_zenith), cos(sun_zenith), and cos(relative_azimuth_angle), both use Sentinel -2 itself comes with different combinations of 12 bands as feature inputs. More details can be found in the official documentation
。
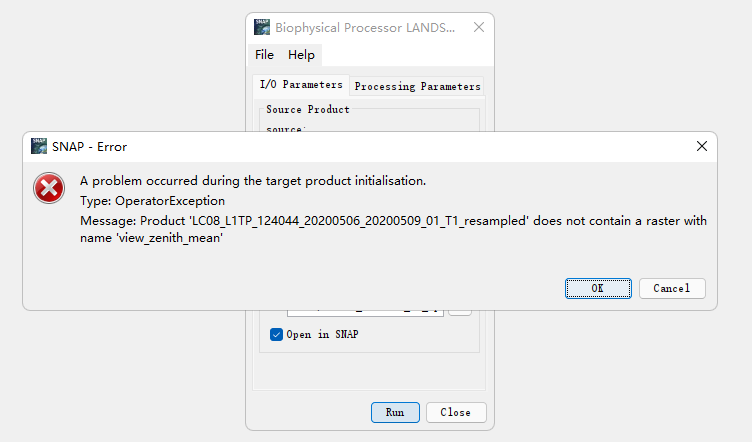
Sentry data itself comes with sensor attitude band data in the documentation while Landsat-8 does not, so processing Landsat data with this module generates “Message: Product ‘LC08_ L1TP_ 124044 20200506 20200509 01 T1 resampled’ does not contain a raster with name ‘view zenith _mean’”.
we searched the official USGS documentation for this requirement and finally found the processing package for generating attitude raster data for Landsat series data, which is described below.
L8-ANGLES-PYTHON packages
This package implements a simple Python interface to the USGS Landsat 8 tool for calculating solar and sensor azimuth and zenith angles per pixel from the angle coefficient file “ANG.TXT”. If you are using anaconda (which is what I use anyway), installing the package is as simple as a single command.
|
|
On the Github page, the official researchers provide a simple edible example.
|
|
Programmers familiar with python will be able to customize the content according to their needs here
Generating pose raster data in python based on L8-angles package
We need to import the relevant packages first
|
|
Because it is learned python early learned, so used two for loop, got landsat file path, for the subsequent batch processing to prepare for.
|
|
Next, import the file, extract the reference information from the raster image, calculate the attitude angle raster data, and place the generated attitude raster data in.
|
|
Final output attitude raster data file.
|
|
The above are all the steps to achieve the generated image is shown in the figure below, which is actually the cover image.
Full Code
Finally, the complete code is attached, so that the big boys can customize the batch method according to their needs:.
|
|
Appendix
The reference blog literature reads as follows: