Preface
Some time ago, I took a small program, the other party seems to need convolution data for experiments, and then need to use multiple vector points to extract 3X3 core and 5X5 core point raster data for experiments, entrusted me to write a python module to extract all vector points around the 9 or 25 raster elevation points, although I do not quite understand this experiment, but after all, it is not impossible to achieve, so simply took the So I just took it and exercised the use of GDAL. The final result is shown in the figure below, and the result is still OK.

Ideas
Here we borrowed the idea of Dalao, the core idea is to carry out the affine transformation of the data, after converting to the coordinates on the graph, and then obtain the convolution kernel according to the addition and subtraction of the two-dimensional array space, and then use the constructed value extraction function for convolution kernel value extraction, of course, it seems very simple to say so However, the actual operation still encounters many problems.
The above Dalao code is only enough to get the value, but not output raster or vector, here add their own ideas, in the case of getting a convolution kernel of 9 coordinates, use OGR to create a vector point layer of 9 points, then based on this layer to extract the raster value, and finally use vector to raster, you can get the effect of the above part of the content.
After you have an idea, start writing code (google)
Main function file
The main function file mainly amplifies functions such as affine transformations and convolution kernels written by the brother, which are imported as other py files.
  1
  2
  3
  4
  5
  6
  7
  8
  9
 10
 11
 12
 13
 14
 15
 16
 17
 18
 19
 20
 21
 22
 23
 24
 25
 26
 27
 28
 29
 30
 31
 32
 33
 34
 35
 36
 37
 38
 39
 40
 41
 42
 43
 44
 45
 46
 47
 48
 49
 50
 51
 52
 53
 54
 55
 56
 57
 58
 59
 60
 61
 62
 63
 64
 65
 66
 67
 68
 69
 70
 71
 72
 73
 74
 75
 76
 77
 78
 79
 80
 81
 82
 83
 84
 85
 86
 87
 88
 89
 90
 91
 92
 93
 94
 95
 96
 97
 98
 99
100
101
102
103
104
105
106
107
108
109
110
111
112
113
114
115
116
|
from osgeo import gdal
from osgeo import ogr,osr
import numpy as np
import re

#Extract the latitude and longitude of all stations
def get_vector_coordinates(filepath):
    driver = ogr.GetDriverByName('ESRI Shapefile')
    #Open vector
    ds = driver.Open(filepath, 0)
    if ds is None:
        print('Could not open ' +'stations.shp')
    layer = ds.GetLayer()
    #Acquisition of elements and geographic location of elements
    xValues = []
    yValues = []
    feature = layer.GetNextFeature()
    while feature:
        geometry = feature.GetGeometryRef()
        x = geometry.GetX()
        y = geometry.GetY()
        xValues.append(x)
        yValues.append(y)
        feature = layer.GetNextFeature()
    coordinates_list = np.array([x for x in zip(xValues,yValues)])


    return coordinates_list


#Generate extraction templates
def Set_GridDataTemplate(grid_size = (5,5), scale = 0.1):
    # Generate a 5*5 grid by default
    grid = [[None] * grid_size[1] for i in range(grid_size[0])]
    start_coordinate = -(grid_size[1] - 1) / 2 * scale
    for i in range(grid_size[0]):
        for j in range(grid_size[1]):
            grid[i][j] = (start_coordinate + j * scale,-start_coordinate - i * scale)
            template = np.array(grid,dtype=object)
    return template

#Get the latitude and longitude around the site
def get_grid_coordinates(vector_coordinates,grid_template):
    grid_coordinates_list = []
    for  i in vector_coordinates:
        lon_lat_grid = [[i] * grid_template.shape[1] for j in range(grid_template.shape[0])]
        grid_coordinates = lon_lat_grid + grid_template
        grid_coordinates_list.append(grid_coordinates)
    return grid_coordinates_list


# Extract raster values
def Extract_value(raster_path,grid_coordinates):
    ds = gdal.Open(raster_path)
    if ds is None:
        print('Could not open image')
    #Get ranks, bands
    rows = ds.RasterYSize
    cols = ds.RasterXSize
    bands = ds.RasterCount
    # Get affine transformation information
    transform = ds.GetGeoTransform()
    xOrigin = transform[0]
    yOrigin = transform[3]
    pixelWidth = transform[1]
    pixelHeight = transform[5]
    all_feature = []
    for i in grid_coordinates:
        feature = []
        count = 0
        lon = 0
        lat = 0
        for j in i:
            count += 1
            for z in range(len(j)):
                if (z + 1) == (len(grid_coordinates[0]) + 1)/2 and count == (len(grid_coordinates[0]) + 1)/2:
                    lon = j[z][0]
                    lat = j[z][1]
                x = j[z][0]
                y = j[z][1]
                #Get the position of the raster where the point is located
                xOffset = int((x-xOrigin)/pixelWidth)
                yOffset = int((y-yOrigin)/pixelHeight)
                # Extract the corresponding image element values on each band
                for n in range(bands):
                    band = ds.GetRasterBand(n+1)
                    data = band.ReadAsArray(xOffset, yOffset,1,1)
                    if data != None:
                        value = int(data[0,0])
                        feature.append(value)
                    else:
                        feature.append(-999)
        feature.append(lon)
        feature.append(lat)
        all_feature.append(feature)
    return all_feature


if __name__ == "__main__":

    shapefile = r'.\shapefile\stations.shp'
    rasterfile = r'.\raster\dem.tif'
    points_vector = get_vector_coordinates(shapefile)
    grid55 = Set_GridDataTemplate(grid_size = (5,5), scale = 0.1)
    coordinates_values = get_grid_coordinates(points_vector,grid55)  #Get latitude and longitude of all pixels around the site
    cal_raster = Extract_value(rasterfile,coordinates_values)
    #cal_raster2 = Extract_value(rasterfile,points_vector)
    print(cal_raster)
    #print(coordinates_values)
    list_2 = [str(x) for item in coordinates_values for x in item]
    out = open(r"\raster.txt", "a+")
    for i in cal_raster:
        out.write(str(i))
    out.close()
|
In the above code, the three functions are directly with the content written by the big brother, the script file running part is added by myself, mainly to output the coordinate points to raster.txt text, if you want to see the detailed output content, you can remove the print() comment, save the change python file as func_all.py, end the first step of work. Of course the script running code of this part of the file is actually only used for testing, and the subsequent is actually mainly to import the file as a package.
Translated with www.DeepL.com/Translator (free version)
OGR create coordinates txt file
osgeo’s OGR package provides a drive to create an ESRI shapefile, just code the code (google), this resource is quite a lot.
 1
 2
 3
 4
 5
 6
 7
 8
 9
10
11
12
13
14
15
16
17
18
19
20
21
22
23
24
25
26
27
28
29
30
31
32
33
34
35
36
37
38
39
40
41
42
43
44
45
46
47
48
49
|
#Importing related packages
from dataclasses import replace
from os import remove
from pkgutil import iter_modules
from matplotlib.pyplot import text
from osgeo import gdal
from osgeo import ogr,osr
import numpy as np
import re
import func_all

raster_path = r'\raster\dem.tif'            #Relative or absolute paths to dem files
filepath = r'\shapefile\stations.shp'       #Site file path
driver = ogr.GetDriverByName('ESRI Shapefile')
#Open vector
ds1 = driver.Open(filepath, 0)
layer = ds1.GetLayer()
xValues = []
yValues = []
feature = layer.GetNextFeature()
while feature:
    geometry = feature.GetGeometryRef()
    x = geometry.GetX()
    y = geometry.GetY()
    xValues.append(x)
    yValues.append(y)
    feature = layer.GetNextFeature()
coordinates_list = np.array([x for x in zip(xValues,yValues)])
grid55 = func_all.Set_GridDataTemplate(grid_size = (3,3), scale = 0.1)  #Here grid55 is the name of the experiment to do 5 * 5, the actual running grid is 3 * 3, but I am too lazy to change back
grid_coordinates_list = []
for  i in coordinates_list:
    lon_lat_grid = [[i] * grid55.shape[1] for j in range(grid55.shape[0])]
    grid_coordinates = lon_lat_grid + grid55
    grid_coordinates_list.append(grid_coordinates)
print(str(grid_coordinates_list).replace('[','').replace(']','') + "\n")
out = open(r"\raster3.txt", "a+")             #Modify path output coordinate paths according to requirements
for i in grid_coordinates_list:
    text1 = str(i).replace('[','').replace(']','\n')
    out.write(str(text1))
out.close()
       # Call the readline() method of the file
file2 = open('\\text2.txt', 'w', encoding='utf-8') # Modify path output coordinates text path according to requirements
for line in file1.readlines():
    line = line.lstrip(' ').replace(' ',',')
    if line == "\n":
        line = line.strip("\n")
    file2.write(line)
    num = line.split(',')
file2.close()
|
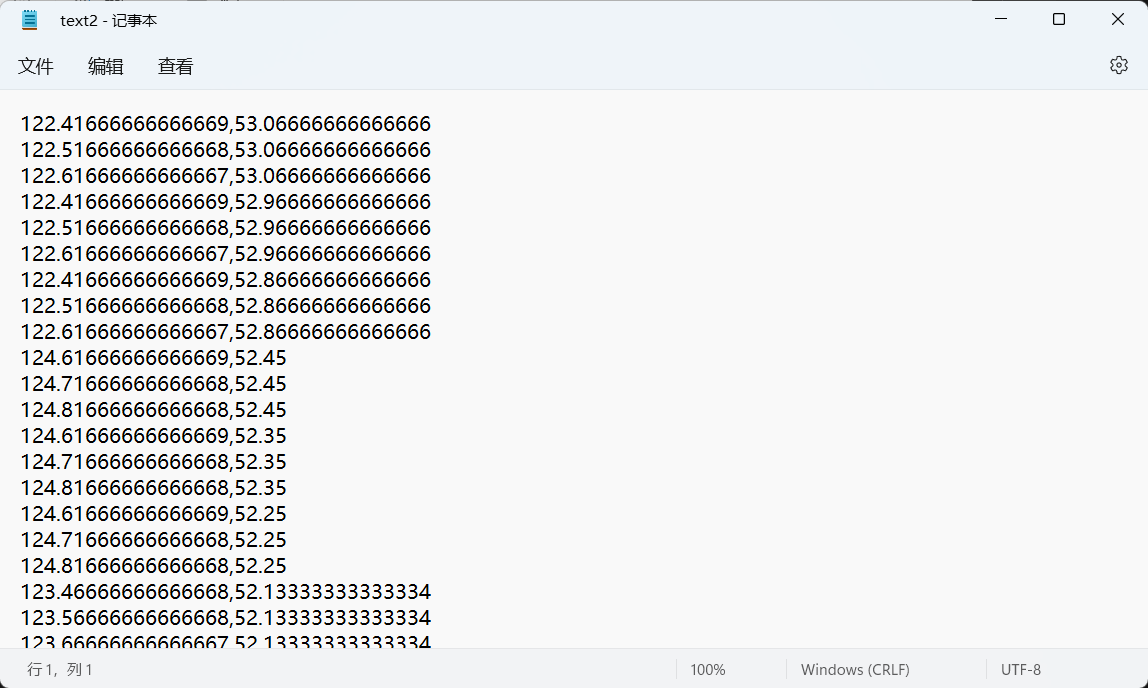
The result of the obtained txt text is shown in the figure below. The result is not preserved in decimal places and needs to be deleted in the subsequent operation.
Create vector point layer from txt coordinate text
Name the file create_point_shp.py
 1
 2
 3
 4
 5
 6
 7
 8
 9
10
11
12
13
14
15
16
17
18
19
20
21
22
23
24
25
26
27
28
29
30
31
32
33
34
35
36
37
38
39
40
41
42
43
44
45
46
47
48
49
50
51
|
from tokenize import Double
from numpy import double
from osgeo import ogr,osr,gdal

raster = r"\raster\dem.tif"
shape = r"\Point.shp"
driver = ogr.GetDriverByName("ESRI Shapefile")
data_source = driver.CreateDataSource(shape) ## shp file name
srs = osr.SpatialReference()
srs.ImportFromEPSG(4326) ## Space reference: WGS84
layer = data_source.CreateLayer("Point", srs, ogr.wkbPoint) ## The layer name should be the same as the shp name
field_name = ogr.FieldDefn("Name", ogr.OFTString) ## Set Properties
field_name.SetWidth(20)  ## Set length
layer.CreateField(field_name)  ## Create field
field_Longitude = ogr.FieldDefn("Longitude", ogr.OFTReal)
layer.CreateField(field_Longitude)
field_Latitude = ogr.FieldDefn("Latitude", ogr.OFTReal)
layer.CreateField(field_Latitude)
field_height = ogr.FieldDefn("Height", ogr.OFTReal)
layer.CreateField(field_height)

dr = gdal.Open(raster)
transform = dr.GetGeoTransform()
x_origin = transform[0]
y_origin = transform[3]
pixel_width = transform[1]
pixel_height = transform[5]
file1 = open('\\text2.txt', 'r', encoding='utf-8')
for line in file1.readlines():
    currentline = line.split(',')
    Longitude = float(currentline[0])
    Latitude = float(currentline[1])
    Longitude = round(Longitude,5)  # Retain 5 decimal places
    Latitude = round(Latitude,5)

    feature = ogr.Feature(layer.GetLayerDefn())
    feature.SetField("Name", "point") ## Set field values
    feature.SetField("Longitude", str(Longitude))  ## Set field values
    feature.SetField("Latitude", str(Latitude)) ## Set field values
    x = Longitude
    y = Latitude
    x_offset = int((x - x_origin) / pixel_width)
    y_offset = int((y - y_origin) / pixel_height)
    dt = dr.ReadAsArray(x_offset, y_offset, 1, 1)
    feature.SetField("Height", int(dt))
    wkt = "POINT(%f %f)" % (float(Longitude), float(Latitude))
    point = ogr.CreateGeometryFromWkt(wkt)
    feature.SetGeometry(point)
    layer.CreateFeature(feature)
    feature.Destroy()
data_source.Destroy()
|
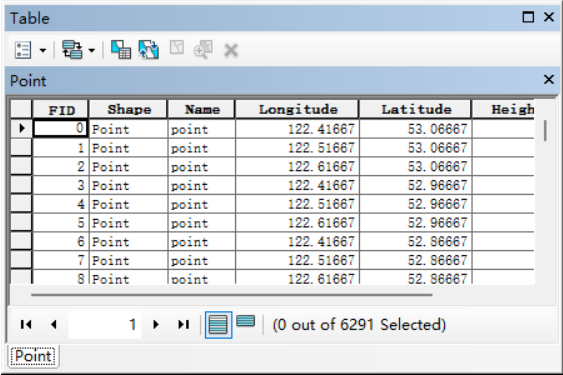
The main idea is to use attributes of OGR to create vector data, create latitude and longitude columns and elevation value columns, read the coordinate values line by line by readline function, create coordinate points, and then write the elevation values of raster data corresponding to the coordinate points to shp file, so that the elevation values can be extracted to shp according to the coordinate points. The effect is shown in the figure below:

Vector to raster
In fact, I think that the elevation information around the study point, directly with shp is enough, but the customer asked to raster, probably want to do other experiments, then vector to raster. This part could not be simpler, after all, there are hands (google) on the line, directly to the code, encapsulated into a function, directly with it.
 1
 2
 3
 4
 5
 6
 7
 8
 9
10
11
12
13
14
15
16
17
18
19
20
21
22
23
24
25
26
27
28
29
30
31
32
33
34
35
36
37
38
|
from osgeo import gdal,ogr,gdalconst

def Rasterize(input_shp,input_tif,output_tif,field,filed_type,NoValue=-9999):
    """
    input_shp:vector file to be converted to raster (vector file path)
    input_tif:template raster to read geo-transformation information, raster size and apply it to the new raster
    output_tif:output raster file (raster file path)
    field:string, field of the raster value
    GDT_Int16,GDT_Int32,GDT_Float32,GDT_Float64,etc.
    NoValue:integer or floating point type, vector blank area after the conversion of the value
    """
    data = gdal.Open(input_tif, gdalconst.GA_ReadOnly)
    geo_transform = data.GetGeoTransform()
    proj=data.GetProjection()
    open_shp = ogr.Open(input_shp)
    shp_ly = open_shp.GetLayer()
    x_min, x_max, y_min, y_max = shp_ly.GetExtent()
    pixel_size = geo_transform[1]
    x_res = int((x_max - x_min) / pixel_size)
    y_res = int((y_max - y_min) / pixel_size)
    target_ds = gdal.GetDriverByName('GTiff').Create(output_tif, x_res, y_res, 1, filed_type)
    target_ds.SetGeoTransform((x_min, pixel_size, 0.0, y_max, 0.0, -pixel_size))
    target_ds.SetProjection(proj)
    band = target_ds.GetRasterBand(1)
    band.SetNoDataValue(NoValue)
    band.FlushCache()
    if field is None:
        gdal.RasterizeLayer(target_ds, [1], shp_ly, None)
    else:
        OPTIONS = ['ATTRIBUTE=' + field]
        gdal.RasterizeLayer(target_ds, [1], shp_ly, options=OPTIONS)
    target_ds = None

input_tif1 = r"raster\dem.tif"
input_shape = r"Point.shp"
output_tif1 = r"test.tif"
Rasterize(input_shp=input_shape,input_tif=input_tif1,output_tif=output_tif1,field= 'Height',filed_type=gdal.GDT_Int16,NoValue=-9999)
|
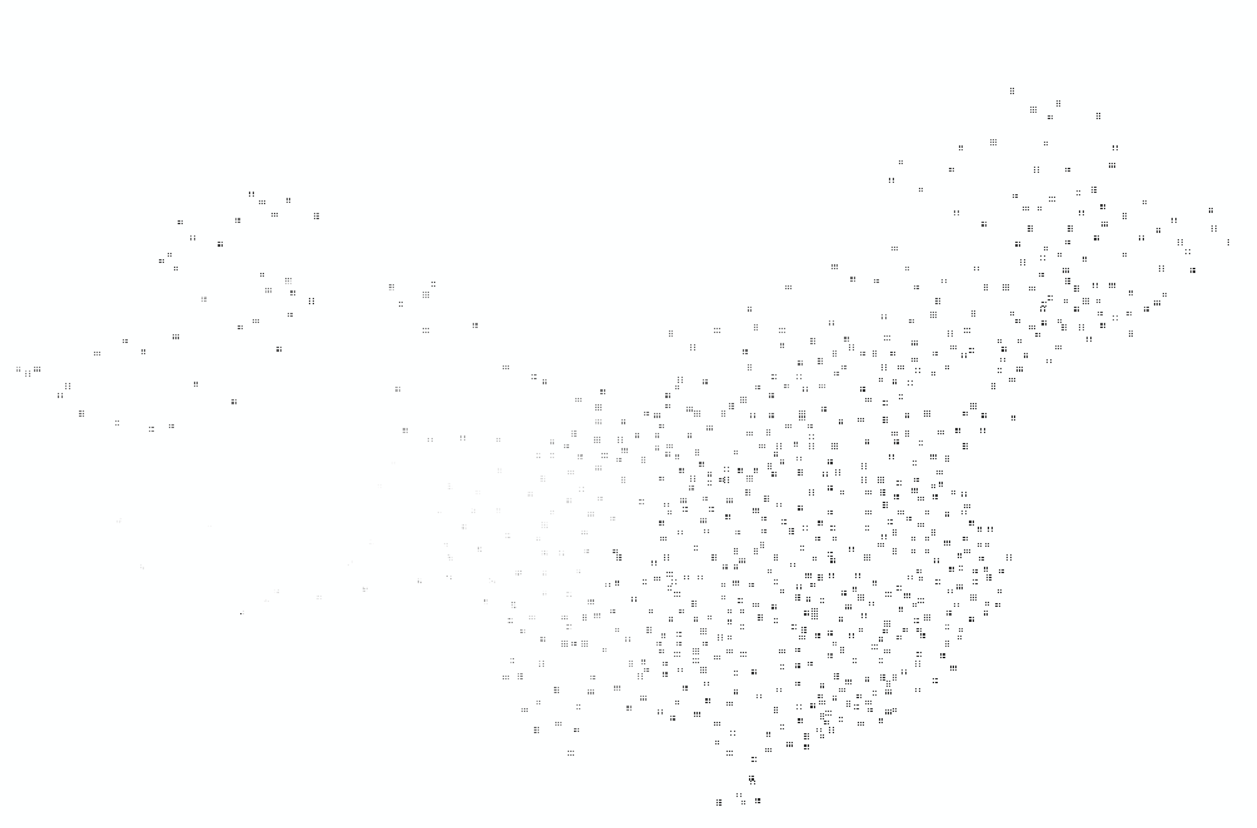
The final result is a nationally distributed convolutional kernel 3X3 image, the effect is shown in the figure below, and the detailed effect is shown in the figure of the content of the first section.
Other
As of course there are many imperfections in this project, such as the fact that the functions used are placed at the beginning of the func_all better, but the small project, the code to the customer, the customer said that they still need to transform, and forget it.
The implementation of the idea is actually still not simple enough, currently think if after extracting the coordinates, not output to txt, but directly to the second part of the regular expression re, will not be more efficient?
Wouldn’t it be faster to create a new raster directly using the coordinate and elevation values in the process of extracting the raster to vector points? This way there is less shp data in the process, but of course at the moment I don’t know how to use this information directly to build the raster, the idea is not open or difficult 😅😅
In addition, all the data used in the experiments here, all from the big brother’s web site, the password is dkbw.
参考博文
- Create geometry from WKT
- Create new shp data and add data
- Rasterize vector layers
- Python GDAL Geological Analysis (VIII) Extracting raster values around vector points